Performance Benchmarking on iOS
Graphics Effects Testing against Flutter and Swift UI on iOS
After testing the Performance Benchmarking of cross-platform applications written with Makepad on Android platforms, we decided to do some tests on iOS.
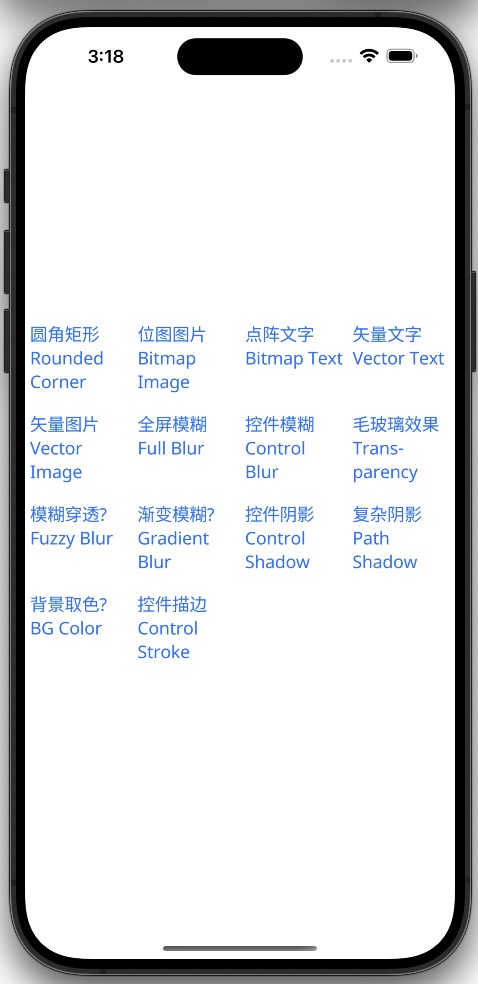
Instead of using the exisitng mock WeChat and TaoBao apps, we had decided to focus more on graphics effects performance. For this, the team at WyeWorks had helped create a suite of graphics effects in an app called comp_demo.
Graphics Effects
The effects below have been implemented in all three apps:
- Rounded Corner
- Bitmap Image RC
- Bitmap Text Scaling
- Vector Text Scaling
- Transparency effects
- Control Shadow
- Path Shadow
- Control Stroke
Implementations
The same set of features were implemented using Swift UI to run as iOS native application, using Flutter to run on iOS.
Using Makepad, the same set of features were implemented and also ran on iOS.
Devices
All 3 apps and tests were ran on the same iPhone 12 and iPhone 13 devices. The devices themselves were "clean" machines, meaning a new machine wihtout any extra applications installed, just the three test apps.
The phones were running iOS 17.3.
Process
Collecting performance metrics on iOS is not as straightforward as on Android. Android's Perfetto tool automates most of the process of collecting and presenting the metrics, both in UI and JSON data formats. But on iOS, the Xcode's Instrumentation tool mainly deals with UI displays of real-time performance graphs. While this is helpful in some situations, it is not sufficient for the metrics that we wanted to collect.
Hence, we had to utilize the xcrun xctrace commands to record metrics we are interested in, then use export to extract the metrics from the proprietary binary file formats into an xml file, and then convert it into csv format in order to be more human readable using a spreadsheet application.
After running through the process several times, we devised scripts to automate as many of these manual steps as possible. This included running one command to start the recording process to do the test. And then one script to extract the proper data, and one more at the end to summarize the data that we're interested in, such as the CPU %, Memory usage, etc.
Results
The results were interesting to see. First, for most of the Swift UI version of the application, the data were not readily or easily seen. It seems that iOS "hides" or "combines" the actual application usage data with the operating system, such that it is not apparent which work was actually peformed and counted as part of the application and which were counted as OS.
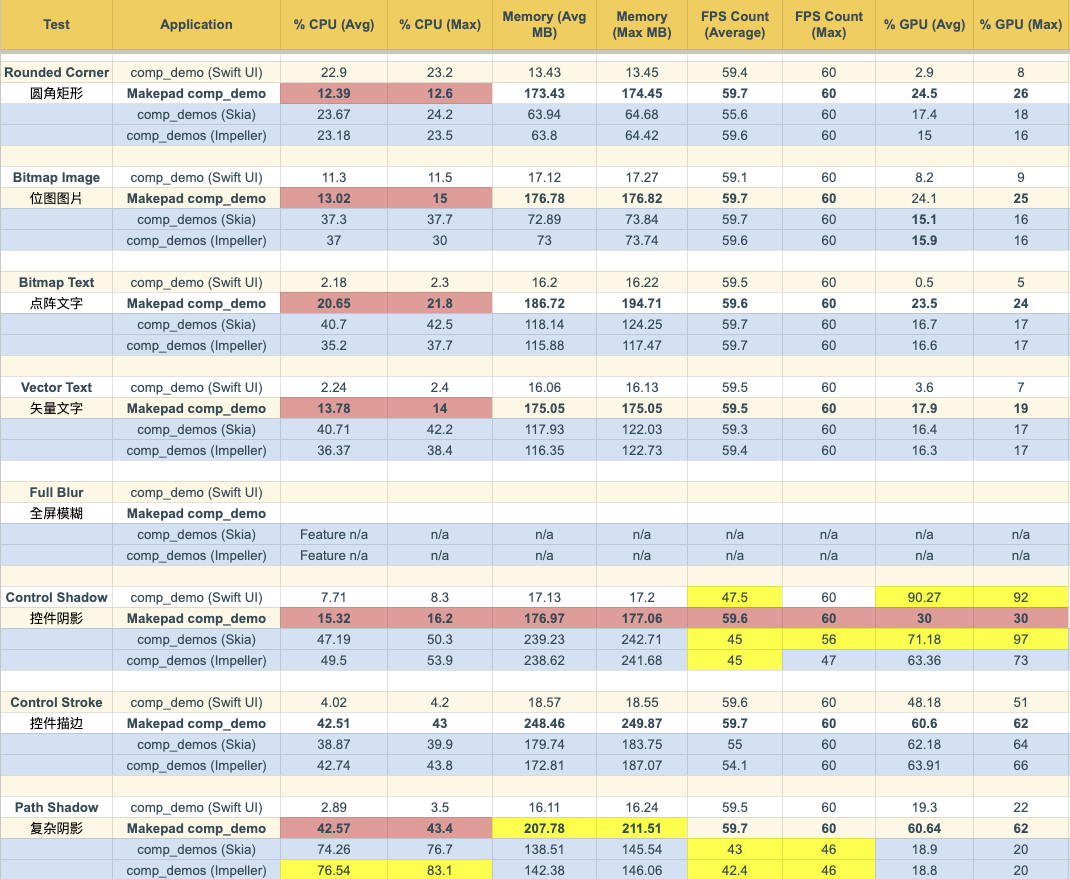 (In the table above, red background means good, yellow means bad)
So the more comparable test results are between the Makepad and Flutter apps. As both of these applications come with their own rendering layer, and do not utilize iOS's own native rendering.
Rounded Corners and Text Scaling
From these results, it can be seen that in general, Makepad app's CPU % usage is often ~50% less than what the Flutter app's were. On the other hand, Makepad app's GPU % usage is often ~30% higher.
Note that memory usage includes both the CPU and GPU memory in this case. Makepad's memory usage is in general much higher than the others. Part of the reason is that currently Makepad still bundles its own big font file as part of the app, which results in about 40MB of memory usage on its own.
As part of the Project Robius's platform abstraction efforts, we hope to add feature for Makepad (and other Rust UI applications) to be able to easily use the underlying platform's system fonts. This will help reduce the memory footprint by a large amount.
These results are actually very similar to those seen in the previous Performance Benchmarking of scrolling tests on Android. At that time, Makepad apps also exhibited the lower CPU but higher GPU usage pattern.
This can be attributed to Makepad's architecture design of doing some work on CPU but doing a lot of other graphics manipulation on the GPU directly by utilizing shader programs. This allows certain graphics operations to be as simple as changing a variable, without the need for repeated drawcalls. Makepad also optimizes drawcalls by minimizing the number of them. It also has the flexibility of allowing users to write shader programs to execute on the GPU.
Shadow Effects
For the shadow effects, we see the huge advantage that Makepad app has over the equivalent Flutter and even Swift apps. Makepad app is the only one that managed a steady 60 fps rendering, while the Swift and Flutter apps struggled to stay in the ~45 fps range.
The large CPU % spike also indicates that it is working extra hard to perform these graphics shadow effects.
Summary
For a relatively new (~4 years) UI framework written in Rust, Makepad's performance can be seen as quite impressive, especially consdering it has been developed mainly by a team of 3 people.
Part of the performance advantages can be attributed to the efficiency of the programming language Rust itself. But a major reason can be attributed to Makepad's novel design approach of having a mixed immediate mode + retained mode rendering system. Currently, the framework has not even begun to optimize specifically for performance tests. For example, the higher memory footprint is a current design decision, and has room for furter optimization according to Rik.
We're looking forward to continuing to work closely with the Makepad team to bring the best cross-platform performance UI framework in Rust to all developers.
References
All tests were performed on the iOS build of the Makepad comp_demo app, running on iPhone 12 and iPhone 13.
Makepad comp_demo app:
https://github.com/project-robius/comp_demo
iOS Benchmarking scripts:
https://github.com/project-robius/benchmarking-ios
Makepad Framework:
https://github.com/makepad/makepad
By: Edward Tan
https://edwardtan.comhttps://x.com/guofoo
https://mastodon.social/@guofoo
https://github.com/guofoo
Published: 2024-05-25